Formulae/Concepts Needed:
> mean and median
> quartiles and interquartile range
> histogram
> cumulative frequency graph
> box-and-whisker plot
> stem-and-leaf diagram
Here is the copy of the practice exercises on Representing and Interpreting Data. The file contains five (10) items. It contains:
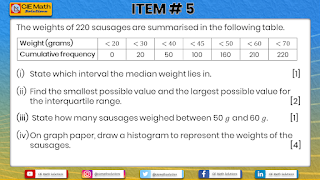
- Items involving histograms
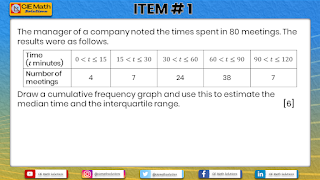
- Items involving cumulative frequency graphs
- Items involving box-and-whisker plots and stem-and-leaf diagrams
You may download the complete copy of the past paper items here (click the image below):
You may also want to try the previous set of past papers on Measures of Central Location and Variation [Part 1] here (click on the image below):
You also want to try the previous set of past papers on Measures of Central Location and Variation [Part 2] here (click on the image below):
Your comments and suggestions are welcome here. Write them in the comment box below. Thank you and God bless!
---------------------------------------------------------------------------------------------------------------
Thank you for your continued support!
Please like, subscribe and share!
Youtube Channel: CIE Math Solutions
Instagram: @ciemathsolutions
Twitter: @ciemathsolution
Facebook Page: CIE Math Solutions


No comments:
Post a Comment
Write your comments and suggestions here.