- Measures of Central Locations and Measures of Spread (Mean and Variance)
- Ungrouped Data
- Grouped Data
- Using Coded Formula
------------------------------------------------------------------------------------------------------------
Your comments and suggestions are welcome here. Write them in the comment box below.
Thank you and God bless!
Thank you and God bless!


ANSWERS:
ReplyDelete1)(i) diagram
(ii) Any two from:
- Children’s estimates more spread out
- Adults estimates lower
- Adults are symmetrical whereas children are skewed
2) n = 22
3) mean = 45.8, sd = 14.9
4) a = 4.5, b = 6
5) (i) new mean = 5.83
(ii) new sd = 1.46
6) (i) graph
(ii) 21.4% (accept 18.5 to 22)
(iii) med = 4.15 (accept 4.1 to 4.2)
7) (i) graph
(ii) h = 22.5 (accept 21 to 23)
(iii) sd = 6.01
8) (i) graph
(ii) 75.1
(iii) mean = 63.4375, var = 7.32
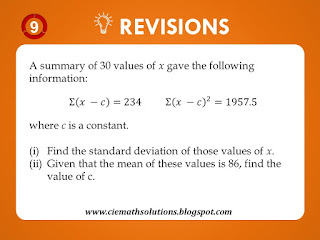
9) (i) sd = 2.1
(ii) c = 78.2
10) Sigma x = 804
Sigma x^2 = 27011.76 (27000 in 3 sf)
Nice 👍
ReplyDelete